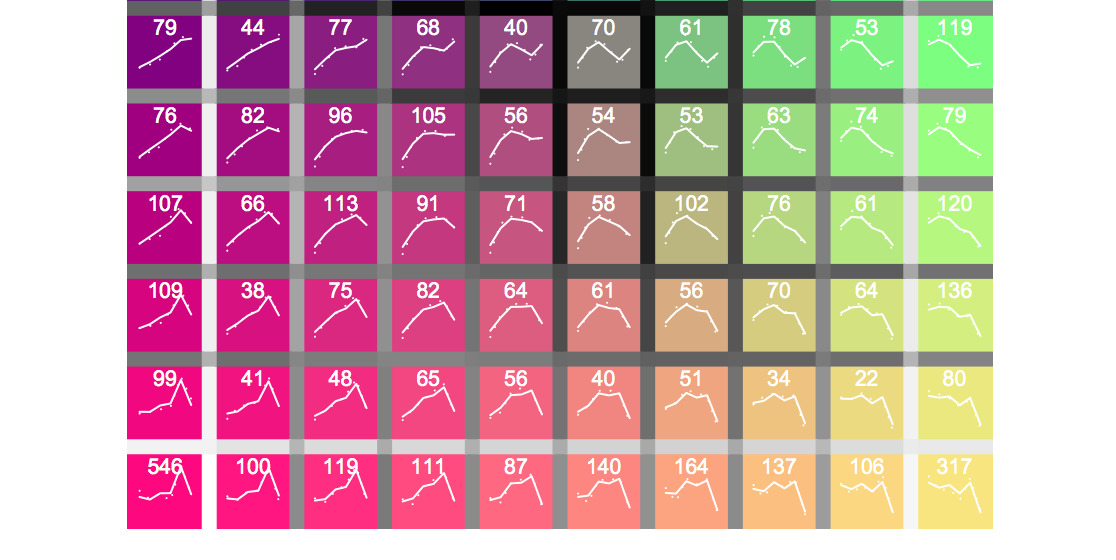
Created a package for the R programming language that generates a visualization/plot of self-organizing maps showing disparity between nodes and the profiles of the weight vectors at each node in a meaningful way. It uses a physical simulation of charged particles bound to each other by springs to position the nodes in a color plane to give variation of color that is directly dependent on the similarity of the nodes to each other.
I also implemented various Self-Organizing Map algorithms from the conventional 2-dimensional SOM to novel 3D SOMs. These have also been parallelized with both OpenMP and MPI for execution on a 90 node, 180 CPU cluster. This allowed us to run some things at up to 80x the speed my workstation at the lab allowed. I investigated using GPUs for the computation, but tools available at the time were not able to achieve any speedups because the algorithm requires a search for the most similar vector in the set which didn’t parallelize well at the time.